Introduction
Observability has become one of the most strategic capabilities in modern software engineering. As organizations continue adopting cloud-native architectures, Kubernetes, serverless platforms, edge computing, AI-powered services, and globally distributed applications, traditional infrastructure monitoring is no longer sufficient. Modern enterprise systems generate billions of telemetry events every day, making manual analysis increasingly impractical.
Historically, monitoring focused primarily on infrastructure metrics such as CPU utilization, memory consumption, disk usage, and network traffic. As distributed architectures evolved, logs and distributed tracing became essential for understanding complex service interactions. However, the growing scale of cloud-native environments has introduced an entirely new challenge: transforming massive amounts of telemetry into actionable operational intelligence.
By December 2024, observability platforms are evolving into intelligent operational systems. Artificial Intelligence, machine learning, OpenTelemetry, eBPF instrumentation, predictive analytics, and autonomous remediation are enabling organizations to move beyond passive dashboards toward platforms capable of understanding system behavior, detecting anomalies, explaining failures, and initiating automated recovery.
Rather than simply visualizing operational data, next-generation observability platforms actively participate in maintaining application reliability.
Industry Background
Modern enterprise platforms increasingly rely on:
- ◆OpenTelemetry
- ◆Kubernetes
- ◆Service Meshes
- ◆eBPF-based Observability
- ◆Distributed Tracing
- ◆AIOps Platforms
- ◆Machine Learning Analytics
- ◆Platform Engineering
These technologies collectively provide deep visibility into complex distributed environments.
The Business Problem
Traditional monitoring environments commonly experience:
- ◆Alert fatigue
- ◆Massive telemetry volumes
- ◆Difficult root cause analysis
- ◆Siloed monitoring tools
- ◆Manual incident response
- ◆Limited operational context
- ◆Increasing Mean Time to Resolution (MTTR)
Organizations require intelligent systems capable of interpreting operational signals automatically while reducing cognitive overload for engineering teams.
Understanding Next-Generation Observability
Next-generation observability combines telemetry collection, AI, automation, analytics, and operational intelligence into a unified platform.
Primary objectives include:
- ◆End-to-end visibility
- ◆Intelligent anomaly detection
- ◆Predictive operations
- ◆Automated root cause analysis
- ◆Autonomous remediation
- ◆Business-aware monitoring
- ◆Continuous optimization
Rather than treating metrics, logs, and traces independently, modern platforms correlate all operational signals into meaningful insights.
Core Architecture
| Component | Responsibility |
|---|---|
| Application Services | Generate telemetry |
| OpenTelemetry Collectors | Standardized telemetry collection |
| eBPF Instrumentation | Kernel-level visibility |
| Metrics Store | Time-series metrics |
| Log Platform | Centralized logging |
| Distributed Tracing Platform | Request flow analysis |
| AI Analytics Engine | Correlation and anomaly detection |
| Automation Platform | Autonomous remediation |
| Incident Management | Alerting and workflow integration |
Together these components create an intelligent observability platform capable of monitoring, diagnosing, and responding to operational events.
How Intelligent Observability Works
- 1.Applications continuously emit metrics, logs, traces, and events.
- 2.OpenTelemetry standardizes telemetry collection.
- 3.eBPF provides deep operating system and network visibility without extensive application changes.
- 4.AI models analyze operational behavior continuously.
- 5.Correlation engines identify abnormal system patterns.
- 6.Root cause analysis narrows probable failure sources.
- 7.Automation platforms initiate predefined remediation workflows where appropriate.
- 8.Engineering teams receive contextual insights rather than isolated alerts.
This continuous feedback loop transforms raw telemetry into operational intelligence.
OpenTelemetry as the Foundation
// Initializing OpenTelemetry SDK and exporting telemetry spans to OTEL collector
const { NodeSDK } = require('@opentelemetry/sdk-node');
const { OTLPTraceExporter } = require('@opentelemetry/exporter-trace-otlp-grpc');
const { getNodeAutoInstrumentations } = require('@opentelemetry/auto-instrumentations-node');

const sdk = new NodeSDK({
  traceExporter: new OTLPTraceExporter({ url: 'grpc://localhost:4317' }),
  instrumentations: [getNodeAutoInstrumentations()]
});

sdk.start()
  .then(() => console.log('OpenTelemetry auto-instrumentation loaded.'))
  .catch((err) => console.error('Error loading OpenTelemetry SDK', err));
By 2024, OpenTelemetry has become the preferred standard for enterprise observability.
Organizations benefit from:
- ◆Vendor-neutral instrumentation
- ◆Unified telemetry collection
- ◆Consistent data models
- ◆Cross-platform interoperability
- ◆Simplified instrumentation
- ◆Portable observability pipelines
Standardization reduces operational complexity while improving ecosystem compatibility.
eBPF-Powered Visibility
Extended Berkeley Packet Filter (eBPF) technologies enable deep runtime visibility without modifying application code.
Common use cases include:
- ◆Network monitoring
- ◆System call tracing
- ◆Container observability
- ◆Performance analysis
- ◆Security monitoring
- ◆Runtime diagnostics
eBPF significantly improves observability while minimizing application overhead.
AI-Powered Operational Intelligence
Artificial Intelligence increasingly assists operations teams by analyzing:
- ◆Historical incidents
- ◆Performance trends
- ◆Infrastructure utilization
- ◆Distributed traces
- ◆Log correlations
- ◆Service dependencies
AI enables engineering teams to identify issues faster while reducing manual investigation.
Predictive Incident Detection
Rather than waiting for failures, intelligent observability platforms increasingly predict operational risks.
Predictive models evaluate:
- ◆Capacity growth
- ◆Latency trends
- ◆Error rate anomalies
- ◆Infrastructure saturation
- ◆Resource exhaustion
- ◆Historical incident patterns
Early detection enables proactive operational management.
Autonomous Remediation
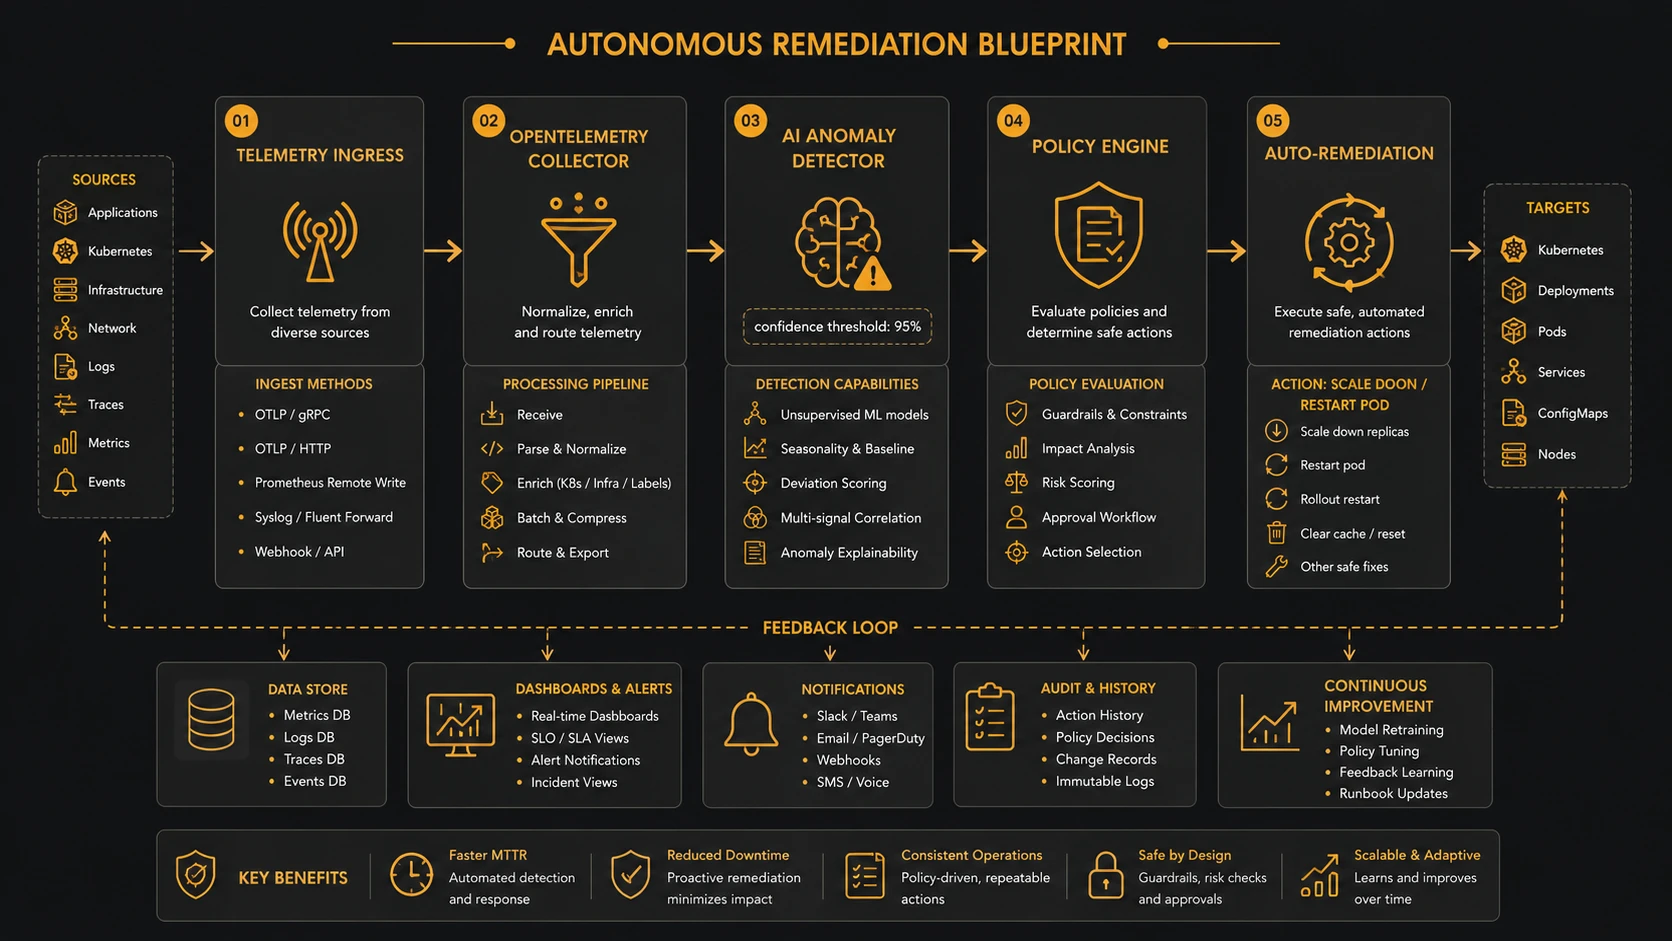
System architecture diagram and conceptual workflow layout for Next-Gen Observability.
Automation platforms increasingly execute predefined operational workflows.
Typical remediation scenarios include:
- ◆Restarting failed services
- ◆Scaling workloads
- ◆Rolling back deployments
- ◆Reconfiguring infrastructure
- ◆Clearing resource bottlenecks
- ◆Opening incident tickets
Human approval may remain appropriate for high-risk production actions.
Business Observability
Modern platforms increasingly monitor business outcomes alongside technical metrics.
Examples include:
- ◆Checkout completion rates
- ◆Payment success ratios
- ◆Customer onboarding progress
- ◆API adoption
- ◆Revenue-impacting failures
- ◆User experience metrics
Business-aware observability helps engineering teams prioritize incidents based on customer impact.
Enterprise Use Cases
Financial Services
Monitor transaction processing, fraud detection systems, and regulatory reporting while reducing operational risk.
Healthcare
Observe patient-facing applications, clinical systems, and healthcare integrations with high availability requirements.
SaaS Platforms
Detect service degradation early while automatically scaling infrastructure during demand spikes.
Retail
Monitor e-commerce performance, inventory synchronization, payment systems, and seasonal traffic events.
Manufacturing
Combine application telemetry with IoT and operational technology data to improve production reliability.
Performance Considerations
Organizations should continuously evaluate:
- ◆Telemetry ingestion rates
- ◆Trace sampling strategies
- ◆Metrics storage efficiency
- ◆AI inference latency
- ◆Dashboard responsiveness
- ◆Alert processing performance
Observability platforms should scale without becoming operational bottlenecks.
Security Considerations
Enterprise observability platforms must securely manage operational telemetry.
Organizations should implement:
- ◆Zero Trust access controls
- ◆Role-based permissions
- ◆Encryption for telemetry pipelines
- ◆Secure OpenTelemetry collectors
- ◆Audit logging
- ◆Sensitive data masking
- ◆Compliance monitoring
- ◆Secure automation workflows
Observability data frequently contains sensitive operational information and should be governed accordingly.
Scalability
Next-generation observability platforms improve scalability through:
- ◆Distributed telemetry pipelines
- ◆Cloud-native storage
- ◆Intelligent sampling
- ◆AI-assisted analytics
- ◆Automated operations
- ◆Standardized instrumentation
These capabilities allow enterprises to monitor increasingly complex systems while maintaining operational efficiency.
Best Practices
- ◆Standardize instrumentation using OpenTelemetry.
- ◆Correlate metrics, logs, traces, and business events.
- ◆Prioritize actionable alerts over alert volume.
- ◆Implement automated runbooks for repetitive incidents.
- ◆Continuously evaluate AI recommendations.
- ◆Measure user experience alongside infrastructure health.
- ◆Design observability as a platform capability rather than a collection of monitoring tools.
- ◆Regularly review telemetry retention and governance policies.
Common Mistakes
| Mistake | Enterprise Impact |
|---|---|
| Collecting every possible metric without prioritization | Increased storage costs and operational noise |
| Treating dashboards as the final objective | Limited operational intelligence |
| Operating disconnected monitoring tools | Fragmented incident analysis |
| Blindly trusting AI-generated remediation | Operational risk |
| Ignoring business impact metrics | Poor incident prioritization |
| Failing to standardize telemetry | Difficult platform integration |
Technology Comparison
| Capability | Traditional Monitoring | Next-Generation Observability |
|---|---|---|
| Primary Focus | Infrastructure Health | System Intelligence |
| Data Sources | Metrics | Metrics, Logs, Traces, Events, Profiles |
| Instrumentation | Vendor-Specific | OpenTelemetry Standard |
| Analysis | Manual Dashboards | AI-Assisted Correlation |
| Incident Response | Human Driven | Intelligent Automation |
| Operational Model | Reactive | Predictive and Autonomous |
Adoption Strategy
- 1.Standardize telemetry collection using OpenTelemetry.
- 2.Consolidate metrics, logs, traces, and events into a unified observability platform.
- 3.Deploy eBPF-based runtime instrumentation where appropriate.
- 4.Introduce AI-powered anomaly detection incrementally.
- 5.Build automated operational runbooks for repetitive incidents.
- 6.Integrate observability with Platform Engineering and DevSecOps workflows.
- 7.Measure operational outcomes using reliability and business KPIs.
- 8.Expand autonomous capabilities gradually while maintaining human governance for high-impact production changes.
Limitations
As of December 2024, autonomous observability continues evolving alongside advances in artificial intelligence and cloud-native platforms. Although AI significantly improves operational visibility and incident response, successful implementations still require high-quality telemetry, standardized instrumentation, mature operational processes, and experienced Site Reliability Engineering (SRE) teams. Autonomous remediation should initially operate within carefully defined governance boundaries to ensure operational safety.
Looking Ahead
From the perspective of December 2024, observability is evolving from a monitoring discipline into an intelligent operational platform. By combining OpenTelemetry, eBPF, distributed tracing, AI-driven analytics, business-aware monitoring, and autonomous remediation, organizations can transform operational data into proactive decision-making systems. As enterprise AI agents, platform engineering, and autonomous infrastructure continue advancing, observability will increasingly shift from explaining what happened to predicting what will happen and automatically maintaining the health, performance, and resilience of modern digital platforms.